Introduction
In academic research and professional studies, data is the foundation of credible findings. But raw numbers alone don’t tell the whole story; they need to be processed, tested, and interpreted. This is where SPSS Analysis comes in. SPSS (Statistical Package for the Social Sciences) is one of the most widely used software tools for statistical analysis. From dissertations and journal articles to business reports and policy research, SPSS simplifies data handling and makes analysis accessible even to those without advanced mathematical backgrounds.
If you’re a student working on a thesis, a researcher handling large survey data, or a business analyst studying market behaviour, understanding how to use SPSS effectively will significantly boost your research quality and credibility. This guide explains what SPSS is, why it’s important, common tests, step-by-step analysis, mistakes to avoid, and how it compares to other tools.
What is SPSS Analysis?
SPSS Analysis refers to the process of using SPSS software to manage, test, and interpret research data. It allows users to:
- Import datasets from Excel, CSV, or databases.
- Perform both descriptive and inferential statistics.
- Create charts, graphs, and tables for visualisation.
- Write APA-standard results for dissertations, reports, and publications.
Who Uses SPSS?

- Students – for assignments, theses, and dissertations.
- Researchers – in psychology, sociology, business, education, and health.
- Organisations – for surveys, performance studies, and customer insights.
Why is SPSS Important in Research?
SPSS is trusted because it makes complex statistics accessible. Here’s why it’s a must-have tool:
- Accuracy – Reduces human error in calculations.
- Efficiency – Runs tests in seconds that would take hours manually.
- Versatility – Supports everything from basic frequency tables to advanced regression models.
- Universality – Accepted by universities, journals, and professional organisations worldwide.
- Interpretation – Offers built-in tables and visuals for easier understanding.
If you’re still deciding your research method, check our guide on Primary vs Secondary Research to see where SPSS fits best.
Key Features of SPSS
SPSS is more than just a number-crunching tool; it offers a structured environment for every stage of research.
1. Data Management
- Import and export data in multiple formats.
- Clean missing or duplicate entries.
- Recode or transform variables.
2. Descriptive Statistics
- Mean, median, mode, standard deviation.
- Percentages and frequency distributions.
3. Inferential Statistics
- t-tests, ANOVA, regression, chi-square.
- Correlation analysis to measure relationships.
4. Data Visualisation
- Bar charts, histograms, scatterplots.
- Publication-ready graphs.
4. Advanced Analytics
- Factor analysis (for identifying patterns).
- Reliability tests (Cronbach’s Alpha).
- Cluster analysis (for grouping data).
SPSS vs Other Data Analysis Tools
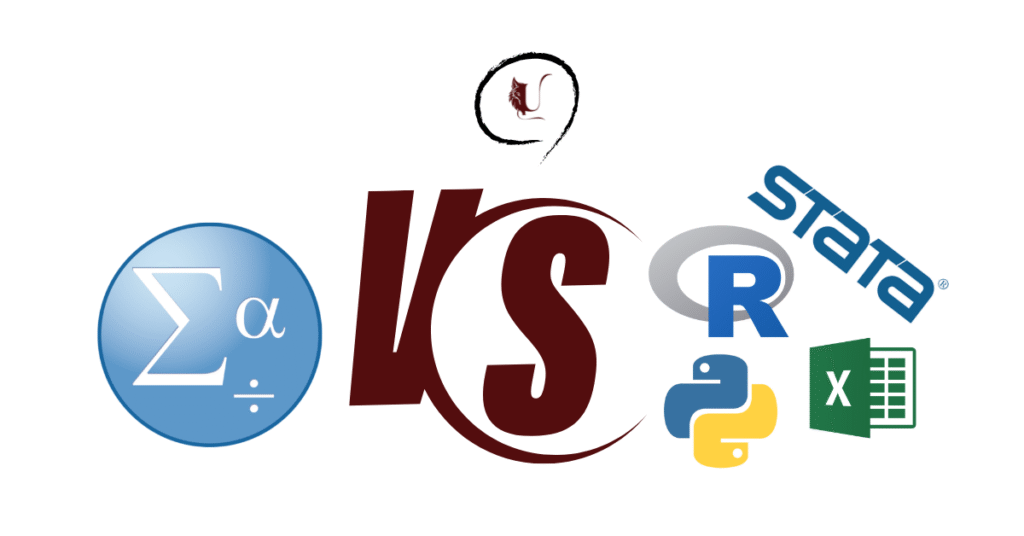
Many students wonder why they should use SPSS instead of Excel, R, or Python. Here’s a quick comparison:
| Feature | SPSS | Excel | R/Python | Stata |
|---|---|---|---|---|
| Ease of Use | ✓ Very beginner-friendly | ✓ Easy for basics | ⚠ Requires coding | ✓ Moderate |
| Data Handling | ✓ Handles large datasets | ⚠ Limited | ✓ Very strong | ✓ Strong |
| Statistical Tests | ✓ Built-in menus | ⚠ Limited | ✓ Advanced | ✓ Advanced |
| Visualization | ✓ Quick charts | ✓ Simple | ✓ Highly customizable | ✓ Good |
| Academic Acceptance | ✓ Globally recognized | ⚠ Limited use | ✓ Growing but technical | ✓ Strong in econometrics |
Verdict
SPSS is the best entry-level tool for students and researchers who need professional analysis without coding.
Common SPSS Tests and Their Applications
Here are the most widely used SPSS tests, with examples:
1. Descriptive Statistics
- Purpose: Summarize data.
- Example: Average GPA of students in a university.
2. Correlation Analysis (Pearson/Spearman)
- Purpose: See relationships between variables.
- Example: Does study time affect exam scores?
3. Regression Analysis
- Purpose: Predict dependent variable from independent variables.
- Example: Impact of advertising spend on sales.
4. Chi-Square Test
- Purpose: Compare categorical variables.
- Example: Do male and female students prefer different study methods?
5. ANOVA (Analysis of Variance)
- Purpose: Compare means of more than two groups.
- Example: Effect of three different diets on weight loss.
6. Reliability Analysis
- Purpose: Test consistency of survey items.
- Example: Checking questionnaire reliability using Cronbach’s Alpha.
How to Run an SPSS Analysis (Step-by-Step Guide)
Step 1: Enter or Import Data
- Open SPSS > File > Import Data (Excel/CSV).
- Ensure variable names are clear and consistent.
Step 2: Choose the Appropriate Test
- Decide based on your research question:
- Comparing groups → t-test or ANOVA.
- Relationships → Correlation or Regression.
- Categorical data → Chi-Square.
Step 3: Run the Analysis
- Go to Analyze in the menu bar.
- Select your statistical test.
Step 4: Interpret Output
- Look at p-values (significance values).
- Example: p < 0.05 → statistically significant.
Step 5: Report Results in APA Style
- Include test type, value, degrees of freedom, and significance.
- Example: t(118) = 2.34, p = 0.02, indicating significant difference.
Common Mistakes Students Make in SPSS
- Choosing the wrong test – Misalignment between research question and method.
- Misinterpreting p-values – Confusing significance with strength of relationship.
- Ignoring assumptions – Not testing for normality, homogeneity, etc.
- Poor data entry – Inconsistent variable coding.
- Overlooking missing values – Can distort results.
SPSS Alternatives
While SPSS is widely used, you might explore:
- R (Free, Open-Source) – Advanced but requires coding.
- Python (Free) – Great for machine learning but technical.
- Stata (Paid) – Strong for econometrics and social sciences.
- Excel (Free/Basic) – User-friendly but limited for advanced tests.
Conclusion
SPSS Analysis is one of the most powerful tools for students, researchers, and professionals to turn raw data into meaningful insights. Its user-friendly interface, accuracy, and global acceptance make it a cornerstone in both academic and applied research. Use SPSS when you need credibility, accuracy, and statistical depth in your research. Pair it with strong research methods (like Primary vs Secondary Research) to build solid and reliable results. Whether you’re writing a dissertation, conducting surveys, or analyzing business trends, SPSS empowers you to present your findings with confidence.
If you want to learn SPSS or need expert help with SPSS analysis, feel free to Contact me
OR
Explore My Services for tailored support.”